
Analytics
Two pages show your numbers:
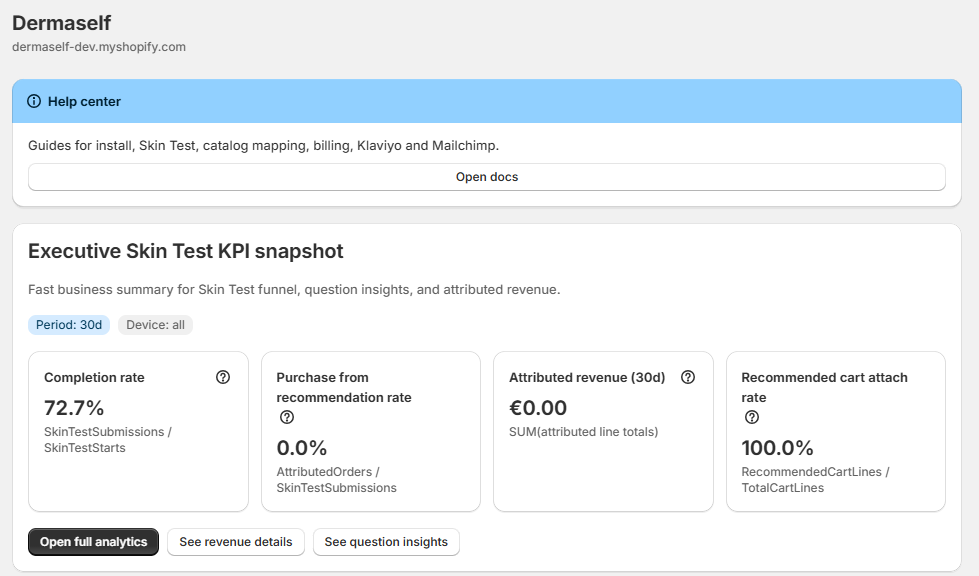
- Home — a KPI snapshot: completion rate, purchases from recommendations, attributed revenue, recommended products in cart, the Skin Test trend and the top recommended products. Buttons open the matching Analytics view.
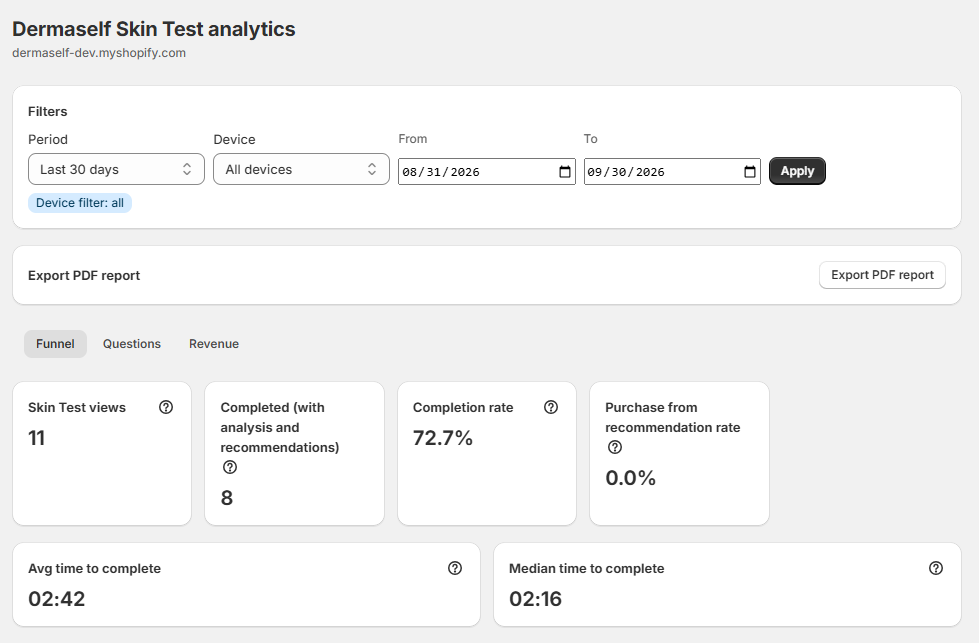
- Analytics — the full report, in three tabs: Funnel, Questions, Revenue.
What each plan sees
| Free (Analytics Base) | Start, Pro, Enterprise (Advanced Analytics) | |
|---|---|---|
| Funnel tab | ✓ | ✓ |
| Questions and Revenue tabs | — | ✓ |
| Period | Last 7 or 30 days | Also last 90 days and custom range |
| Device filter | — | ✓ |
| Purchased products and skin-metric breakdowns | — | ✓ |
| PDF export | ✓ | ✓ |
Analytics, step by step
- Open Analytics.
- In Filters, pick the Period and, on Start and Pro, the Device. Click Apply.
- Read the tabs:
- Funnel — Skin Tests viewed → completed with analysis → purchases from recommendations; the daily trend and the top recommended products.
- Questions — drop-off by Skin Test step and how answers are distributed, question by question.
- Revenue — recommended products purchased, share of recommended products in carts, and a sample of attributed order lines.
- Switch between Numbers and Percentages where available.
- Click Export PDF report to download the report.
How attribution works
Products added to the cart from the Skin Test recommendations carry the _recommended_by_dermaself line property. Orders with those lines count as purchases from recommendations.
Empty charts mean there are no sessions in that period: run a test Skin Test on the live store after you add it to your theme and publish it.